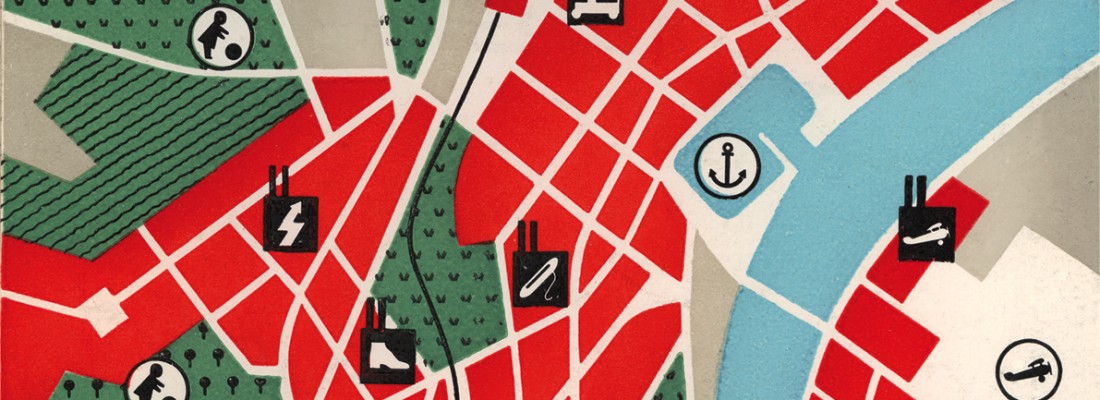
Architects are trained to distinguish between two kinds of maps: representational ones and those that serve as heuristic architectural devices. While representational maps are usually drawn to make observations more accessible to a larger audience, the map as an architectural tool serves as a device for design thinking. By means of drawing space it makes relationships visible that could not have been conceived without the drawing. When deploying such maps, architects pay close attention to the particularities of space, because insight can only be gained when non-spatial observations are put in precise relationship to the specific terrain. Its synergy generates new content, meaning, knowledge and possible design solutions. Austrian philosopher and economist Otto Neurath (1882 – 1945) was famous for his engagement with representational maps. He revolutionized the discipline of chart making by finding a way to create picture statistics and quantitative maps that were accessible to a larger public. In this book I will argue that Otto Neurath’s map “City Planning” served not only as one of the first easily accessible socio-political maps of a city, but that it was in effect also a heuristic device. Originally crafted in color, “City Planning” was edited to appear in red, black and white, accompanying Neurath’s text “Visual Representations of Architectural Problems,” in Architectural Record in July 1937.1 The text and the 1937 map were a direct reaction to a similar and in effect more extensive mapping operation pursued by CIAM IV (Congrès Internationaux d’Architecture Moderne, International Congresses of Modern Architecture) in 1933. Nonetheless it was Neurath who first illustrated the socio-political map for urbanism according to graphic rules and with a graphic vocabulary that possessed a consistent logic and even syntax. In addition, this map reveals to what degree Neurath perceived of the city as an agglomeration of social facts and to what extent his socio-political map contributed to planning the city on such basis.
Austrian philosopher and economist Otto Neurath (1882 – 1945) was famous for his engagement with representational maps. He revolutionized the discipline of chart making by finding a way to create picture statistics and quantitative maps that were accessible to a larger public. In this book I will argue that Otto Neurath’s map “City Planning” served not only as one of the first easily accessible socio-political maps of a city, but that it was in effect also a heuristic device.
Originally crafted in color, “City Planning” was edited to appear in red, black and white, accompanying Neurath’s text “Visual Representations of Architectural Problems,” in Architectural Record in July 1937.1 The text and the 1937 map were a direct reaction to a similar and in effect more extensive mapping operation pursued by CIAM IV (Congrès Internationaux d’Architecture Moderne, International Congresses of Modern Architecture) in 1933. Nonetheless it was Neurath who first illustrated the socio-political map for urbanism according to graphic rules and with a graphic vocabulary that possessed a consistent logic and even syntax. In addition, this map reveals to what degree Neurath perceived of the city as an agglomeration of social facts and to what extent his socio-political map contributed to planning the city on such basis.
